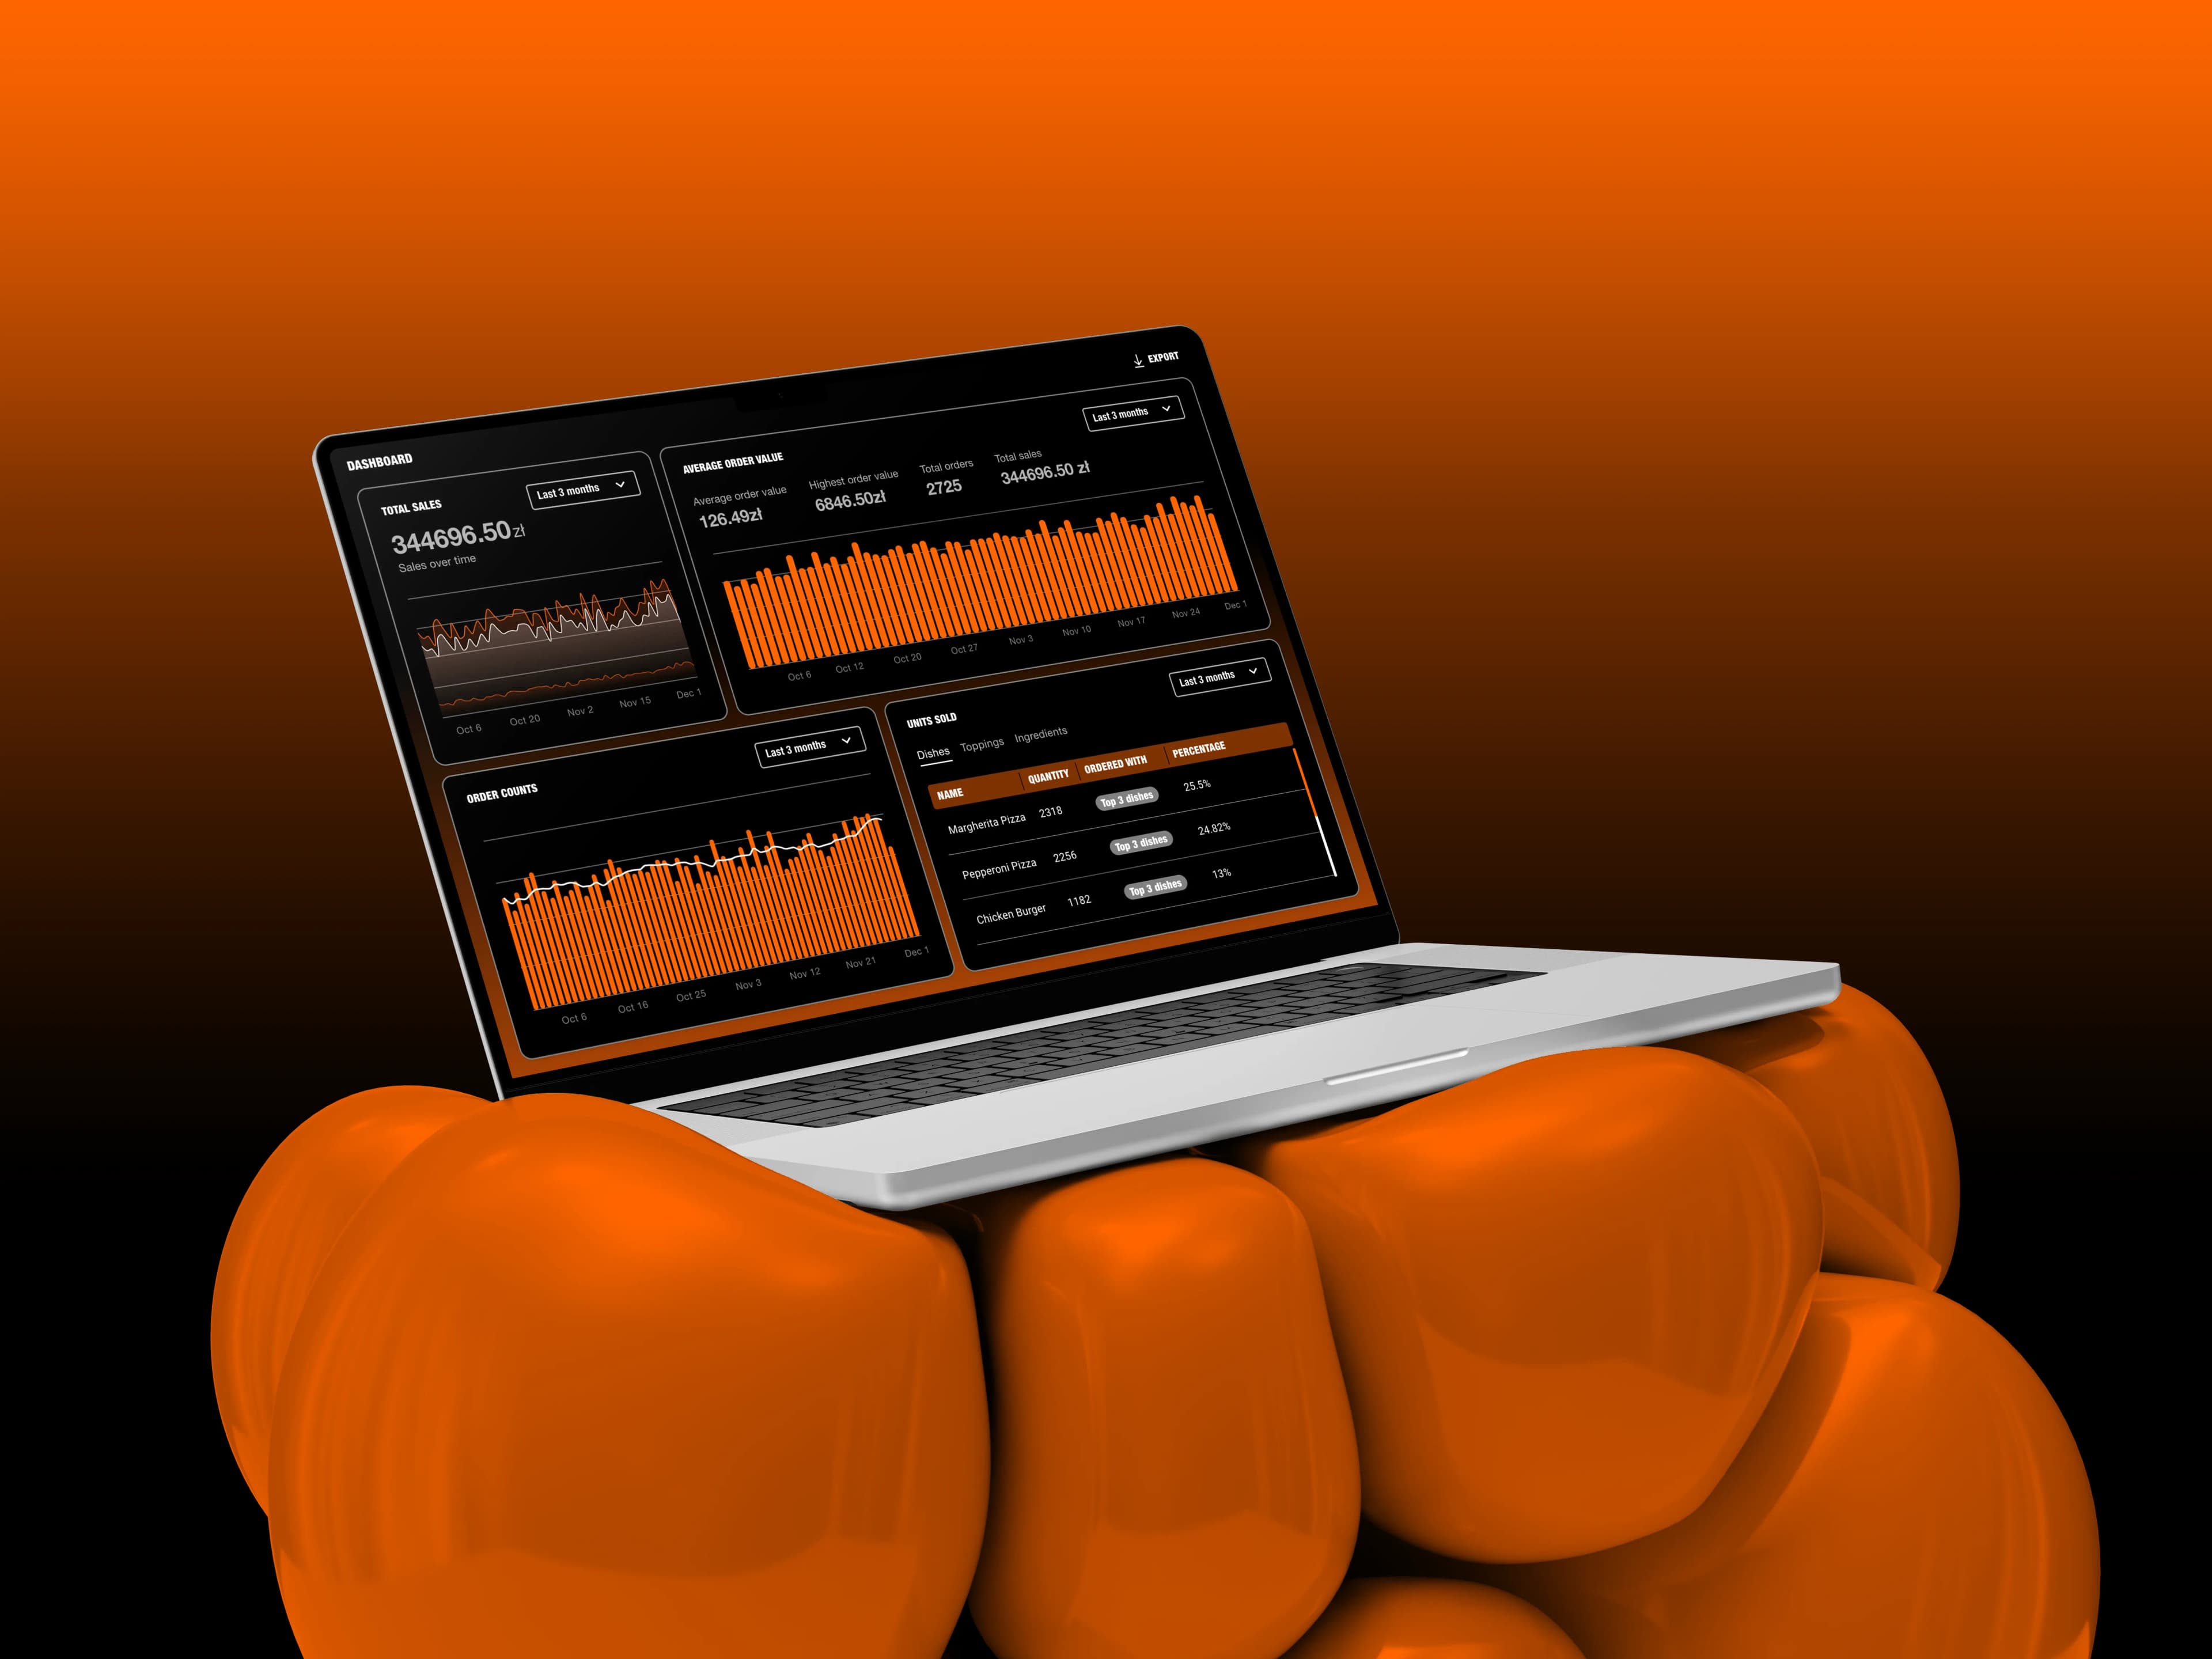
Data that drives decisions.
Stop guessing what works. The dashboard surfaces the patterns behind your revenue so you can act fast, adjust smart, and grow with confidence.
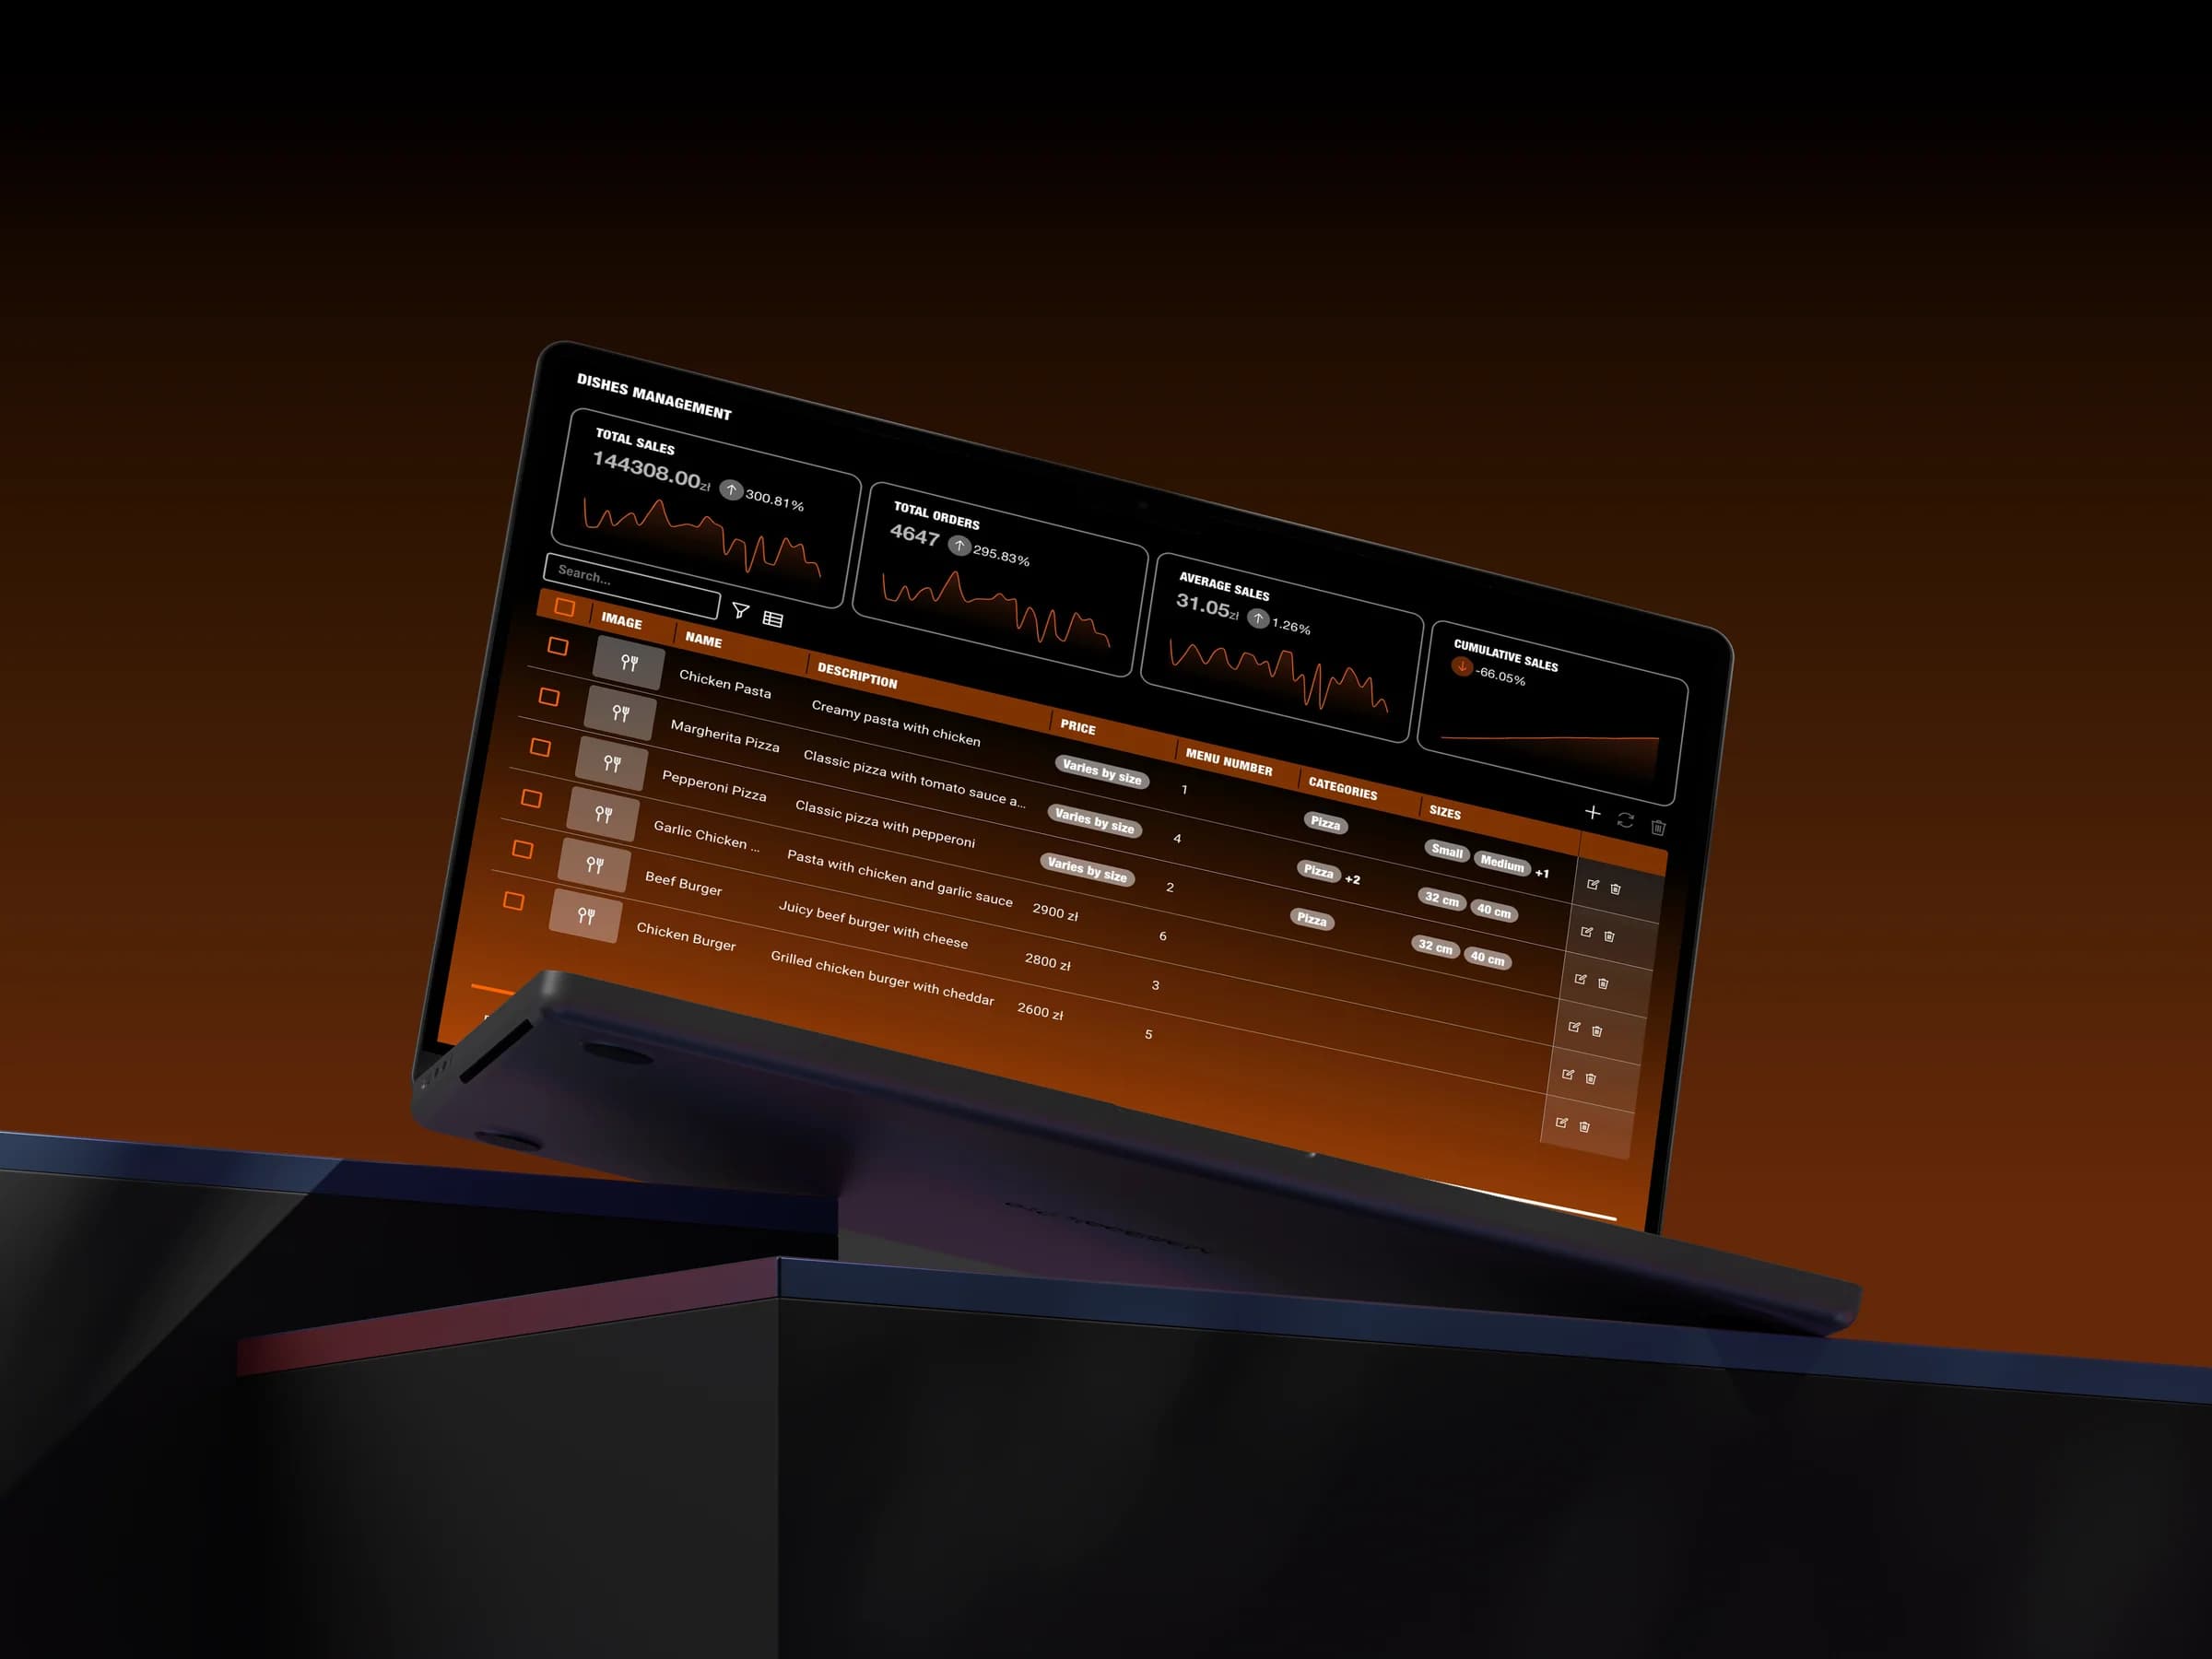
Sales trends
Compare the current period with the previous one and spot the change before it costs you.
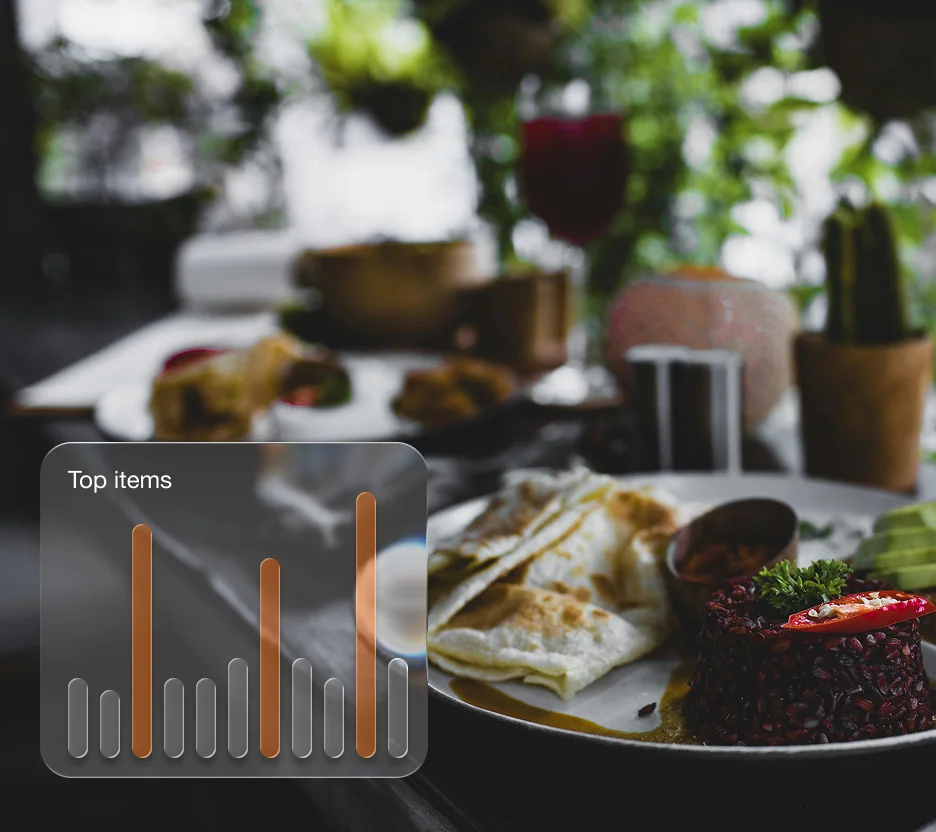
Top items
Which dishes and toppings drive revenue, and which just take up space on the menu.

Staff performance
Rank your team by rating, revenue, hours or attendance, and see who climbed since last period.

Inventory consumption
Ingredient usage by unit (count, weight, volume) so reorders are based on what actually went out.
Be the first to get access.
We’re launching soon. Leave your details and we’ll reach out as soon as we’re ready for you. No commitment.
Everything your restaurant needs, connected.
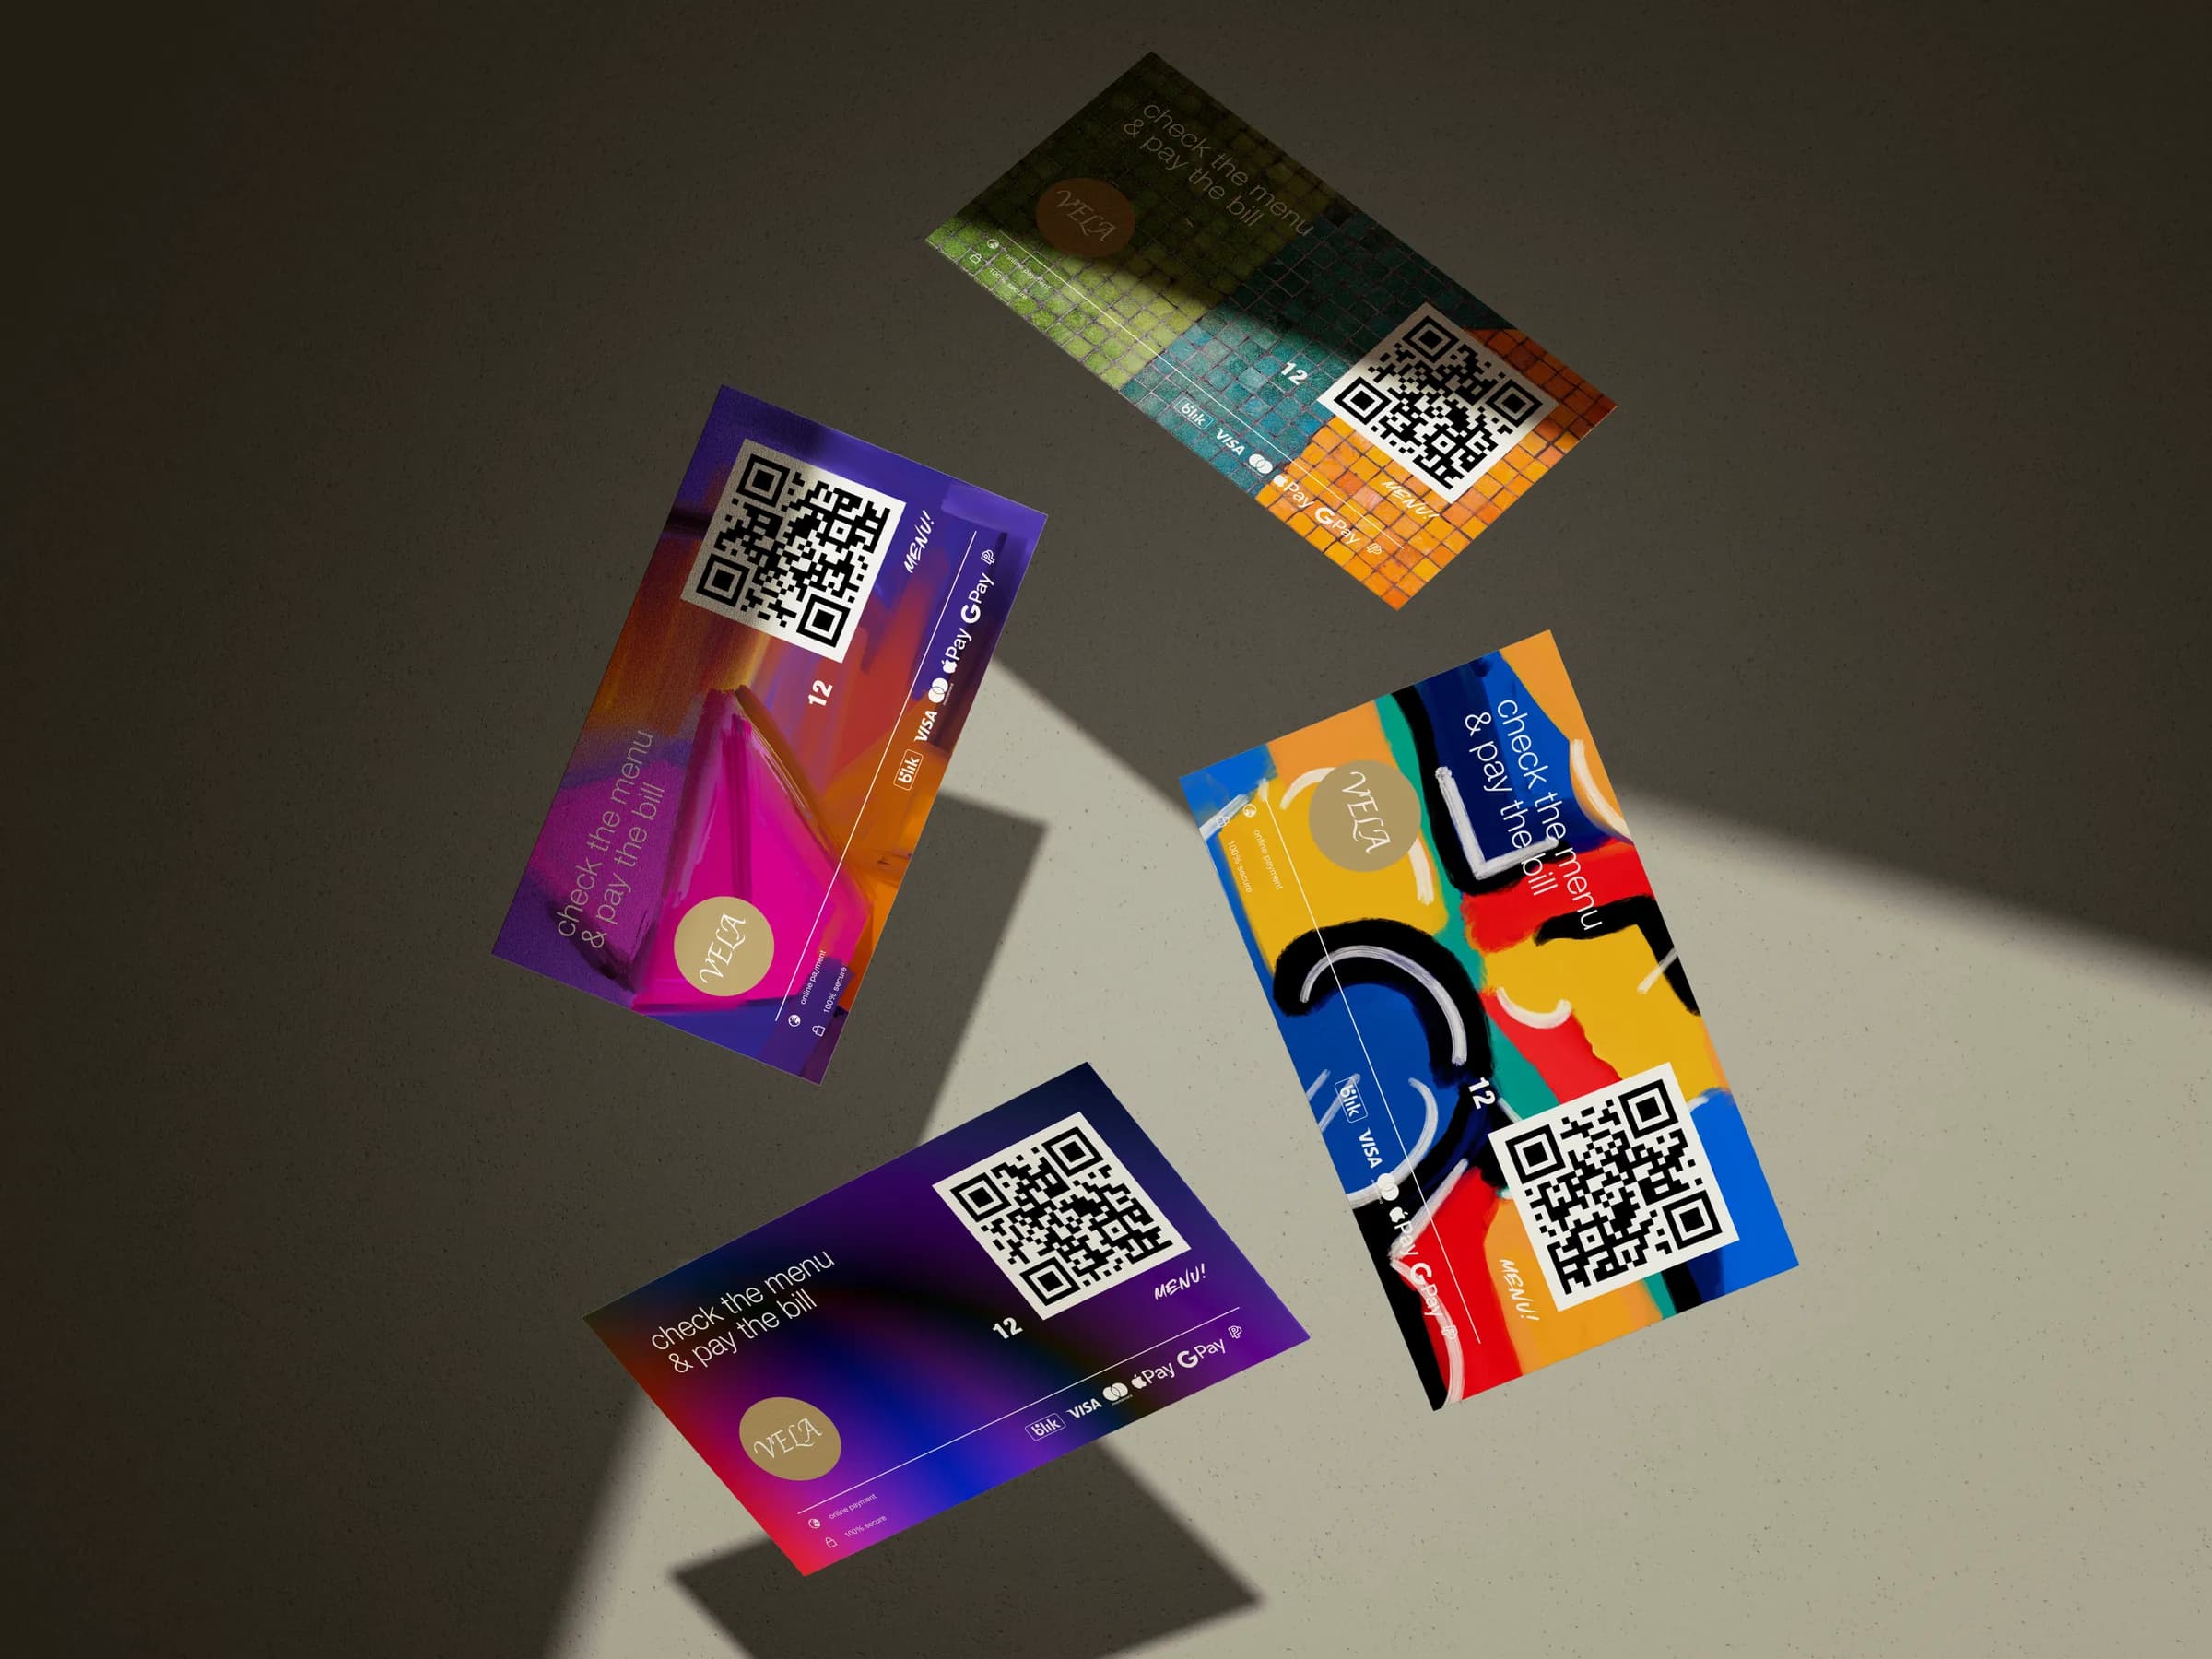
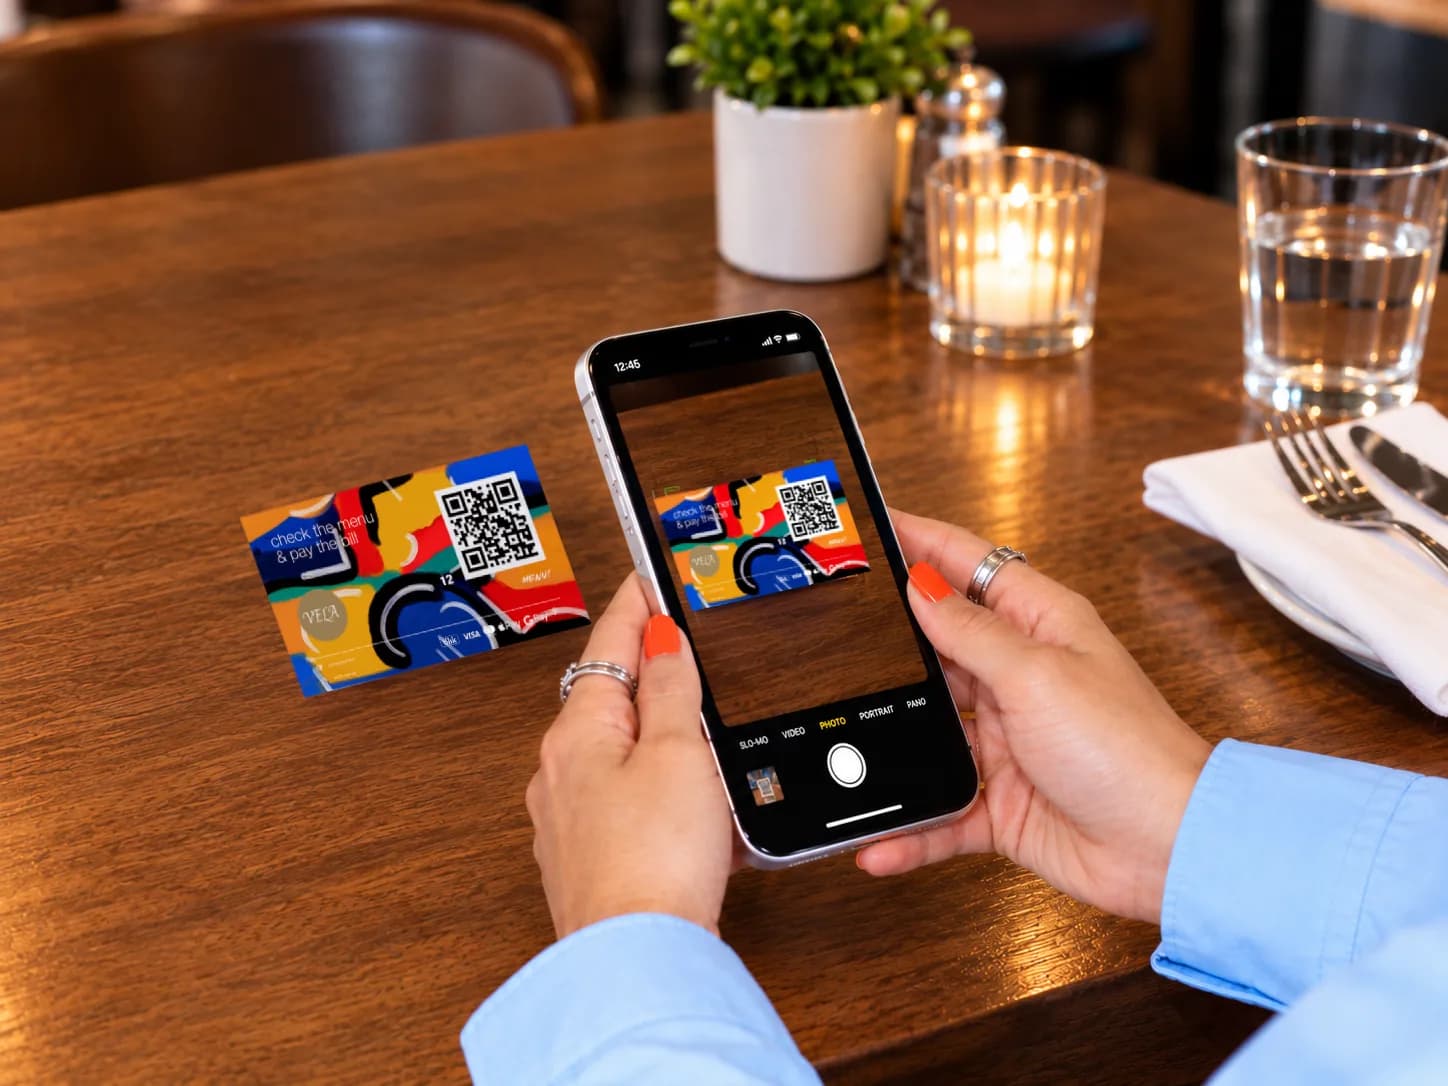
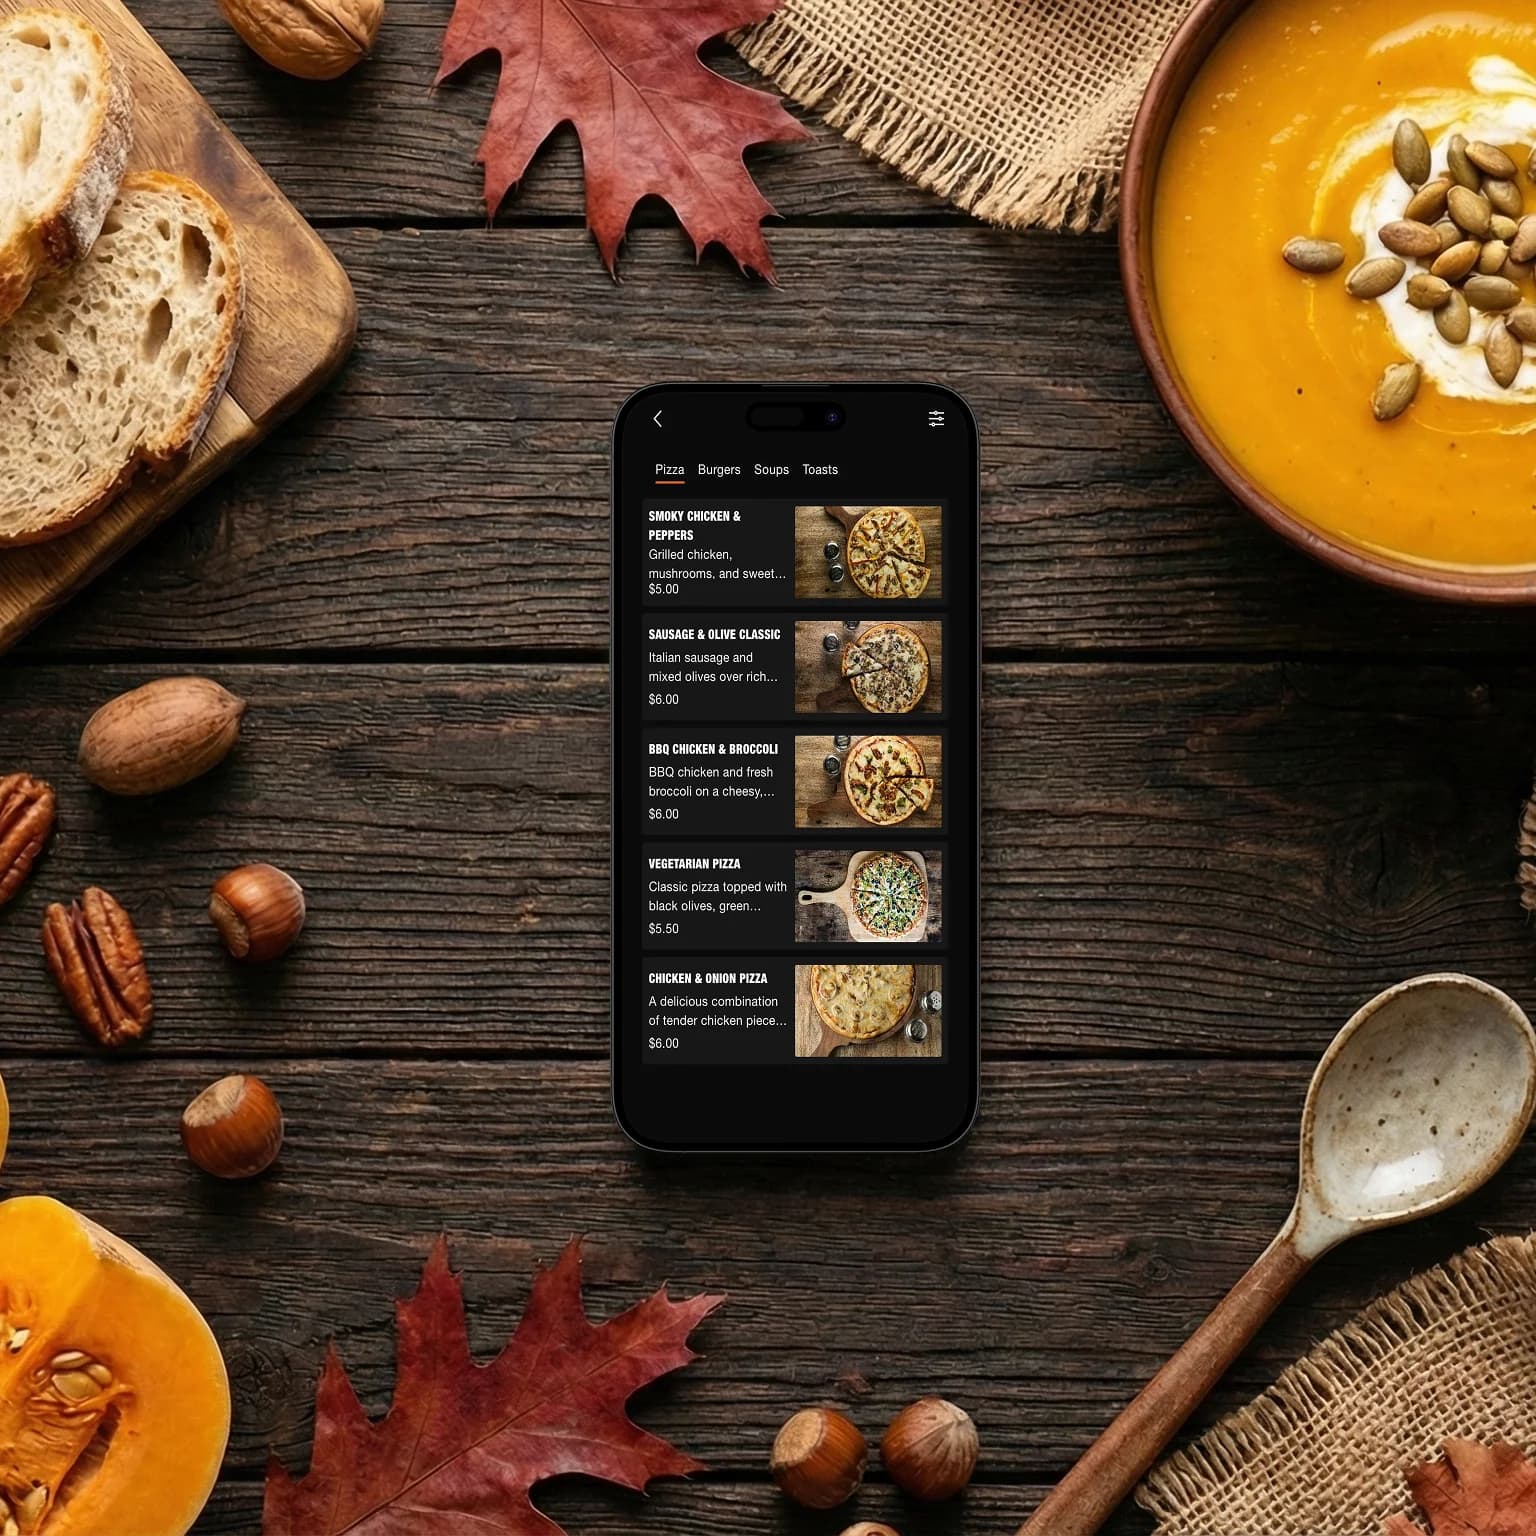
Beyond QR payments, unlock digital menus, real-time analytics, review growth, and smarter tipping, built to work together in one seamless system.